Chapter 25 Demand for Resources (Chapter 26 contains Monopsony)
Labor demand introduction and here and here. Cost minimizing using MP/dollar here.Practice tests and more here.
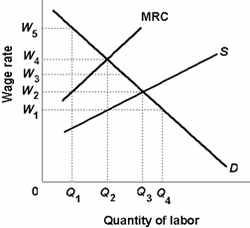
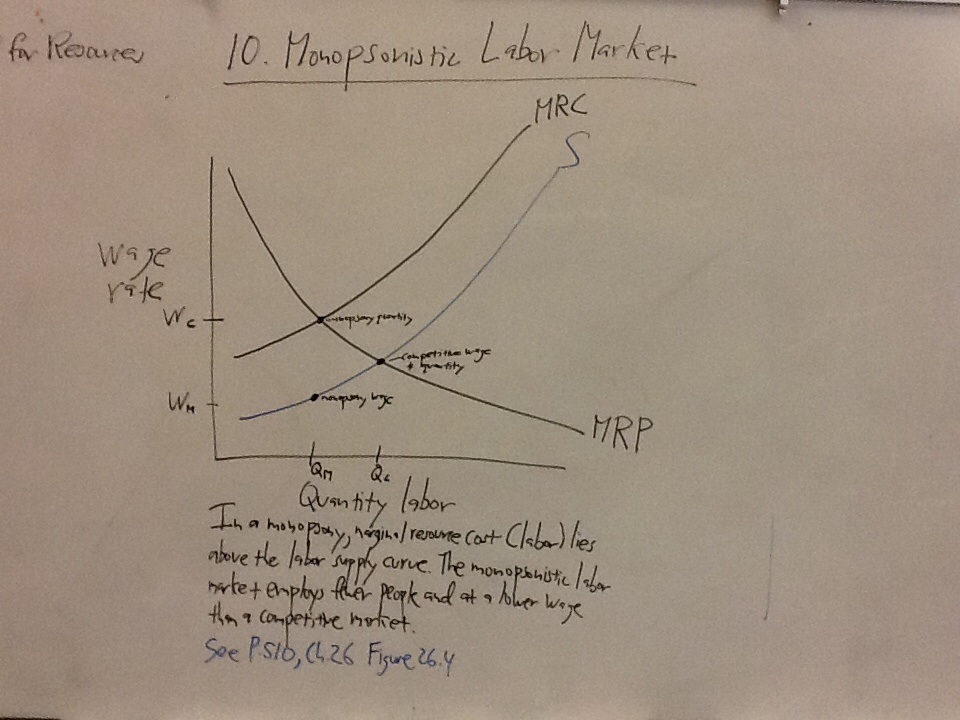
The competitive wage and monopsony wage, respectively, are what levels of W?
W2 and W1.
In a competitive market, the wage is determined by the intersection of market supply and market demand: Q3 workers are hired at a wage of W2. A monopsony maximizes profits by equating the marginal resource cost (MRC in the diagram) with marginal revenue product (D in the diagram), so hires Q2 workers. In order to attract Q2 workers it need only pay a wage of W1.
| factor_markets.ppt |
| factors_markets_part_ii.ppt |
| least_cost_hiring.ppt |
| chap012.ppt |
| competitive_vs_market_power_firms.ppt |
| monopsony.ppt |
Chapter 28 Government and Market Failure
| public_goods__taxes.ppt |
| apeconch28public_v_private_goods.ppt |
Practice tests and more here.
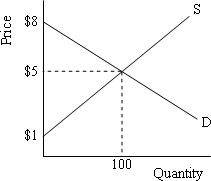
At the equilibrium price and quantity, consumer surplus in this market is:
the area below the demand curve but above the price. The area in this example is equal to ½ x ($8 – $5) x 100, or $150.
the area below the demand curve but above the price. The area in this example is equal to ½ x ($8 – $5) x 100, or $150.
