|
|
Extra Credit
Already? Yes, read pp. 14-71 in the fun comic book on economics, Economix, by Goodwin and Burr. Write up a summary of what you read.
Or read Street smarts: adventures on the road and in the markets by Rogers, and write up a summary of what you read. |
Chapter 1: Intro
| |||||||||||||||||||||||||||||||||||||
| double_eagle.pdf |
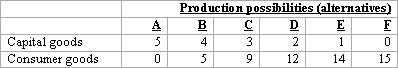
Answer the question on the basis of the data given in the above production possibilities table.
The data in the table indicate that increasing production of capital goods requires increasing sacrifices of consumer goods.
Poverty in the US.
Basic demand graphing below.
Many thanks to Redwood High School AP economics teacher Paul Ippolito for use of his PowerPoints.
Chronicle article on supply and demand in housing.
Chronicle article on supply and demand in housing.
| introsupplydemand.ppt |
| supplydemandshifts.ppt |
| pricefloors.ppt |
| bothcurveshifts.ppt |
| college.docx |
Price floor costs jobs in Sacramento
Practice tests and more here for Chapter 3. Another practice test.
Practice tests and more here for Chapter 3. Another practice test.

|
Chapter 5 Trade
| introduction_to_economics-1.ppt |
| econassumptions.ppt |
| ppf-1.ppt |
| circularflow.ppt |
PPF video
PPF/PPC practice
From UCSD economist Jeffrey Clemens:
The Minimum Wage and the Great Recession: Evidence from the Current Population Survey
I analyze recent federal minimum wage increases using the Current Population Survey. The relevant minimum wage increases were differentially binding across states, generating natural comparison groups. I first estimate a standard difference-in-differences model on samples restricted to relatively low-skilled individuals, as described by their ages and education levels. I also employ a triple-difference framework that utilizes continuous variation in the minimum wage's bite across skill groups. In both frameworks, estimates are robust to adopting a range of alternative strategies, including matching on the size of states' housing declines, to account for variation in the Great Recession's severity across states. My baseline estimate is that this period's full set of minimum wage increases reduced employment among individuals ages 16 to 30 with less than a high school education by 5.6 percentage points. This estimate accounts for 43 percent of the sustained, 13 percentage point decline in this skill group's employment rate and a 0.49 percentage point decline in employment across the full population ages 16 to 64.
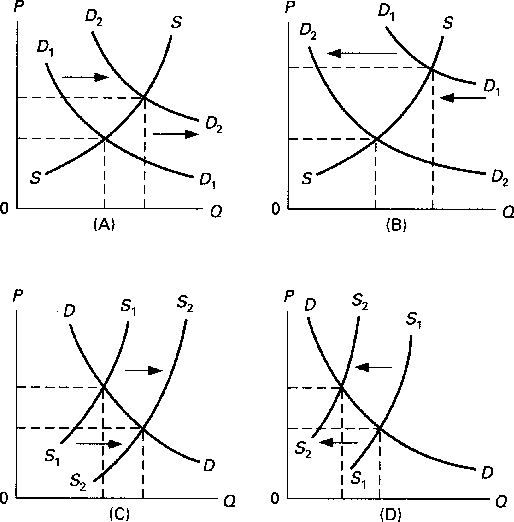
Which one of the diagrams best illustrates the effect of an increase in crude oil prices on the market for gasoline?
PPF/PPC practice
From UCSD economist Jeffrey Clemens:
The Minimum Wage and the Great Recession: Evidence from the Current Population Survey
I analyze recent federal minimum wage increases using the Current Population Survey. The relevant minimum wage increases were differentially binding across states, generating natural comparison groups. I first estimate a standard difference-in-differences model on samples restricted to relatively low-skilled individuals, as described by their ages and education levels. I also employ a triple-difference framework that utilizes continuous variation in the minimum wage's bite across skill groups. In both frameworks, estimates are robust to adopting a range of alternative strategies, including matching on the size of states' housing declines, to account for variation in the Great Recession's severity across states. My baseline estimate is that this period's full set of minimum wage increases reduced employment among individuals ages 16 to 30 with less than a high school education by 5.6 percentage points. This estimate accounts for 43 percent of the sustained, 13 percentage point decline in this skill group's employment rate and a 0.49 percentage point decline in employment across the full population ages 16 to 64.
Which one of the diagrams best illustrates the effect of an increase in crude oil prices on the market for gasoline?
Chapter 4 The US Economy
|
| ||||
Bloomberg: The average American's income declined almost one percent in 2014, to $64,432. The income of the poorest fifth of the population fell by 3.5 percent, to $9,818, while the income of the wealthiest fifth rose nearly one percent, to $166,048...incomes have gained every year since 2013, but that growth hasn’t been even.
Conservative view of income inequality
Liberal view of income inequality
Cooperatives versus capitalism
Liberal view of income inequality
Cooperatives versus capitalism
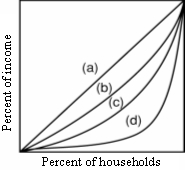
The Gini coefficient measures the inequality among values of a frequency distribution (for example levels of income). A Gini coefficient of zero expresses perfect equality, where all values are the same (for example, where everyone has an exactly equal income). A Gini coefficient of one (100 on the percentile scale) expresses maximal inequality among values (for example where only one person has all the income)
Refer to the diagram above. Suppose the economy's income distribution is represented by line b. An increase in income inequality would be represented by a movement:
A)to line a
B)up and to the right along line b
C)to line c
D)down and to the left along line b
If there were an increase in inequality, a given percent of the population at the bottom—the lowest 20%, for example—would receive a smaller percent of total income. The Lorenz curve would sag further away from the diagonal.d to the left along line b
One can make a logical case for redistributing income from rich to poor by arguing that:
A)the total utility of income for the rich exceeds that of the poor
B)the marginal utility of income for the poor exceeds that of the rich
C)income redistribution increases the incentives to work
D)income redistribution helps to fill up poor persons' leaky buckets
Diminishing marginal utility of income implies that taking a dollar from a rich person and giving it to the poor will increase their combined utility: the utility gain to the poor will exceed the utility loss to the rich.
| herd_immunity_and_positive_externalities.pptx |
| trade.ppt |
| tradeanalysis.ppt |
| exchange_rates.ppt |

|
